
Interesting numbers --- zero --- one --- complex --- root 2 --- golden ratio --- e --- pi --- googol --- infinity
The square of a number is itself multiplied by itself. It's written with a little 2 above and after the number. So 32 = 9 means three squared is nine. The opposite of a square is a square root, which looks a little like a tick. So √9 = 3. However, (-3)2 = 9 as well. so √9=±3. This leads to the question, what is √(-1)? Mathematicians have invented a new type of number called i. So
i2 = -1 -i2 = -1
√(-1) = ±i √(-4) = ±2i
These are called imaginary numbers. If you mix real numbers and imaginary numbers, you get complex numbers, such as 2+3i. You do arithmetic with complex numbers, by calculating the imaginary and real parts separately, but remembering that i2=-1.
You may wonder what √i is. It turns out that √i = (1 + i) / √2. You can prove this by squaring it.
| ((1 + i) / √2)2 | = (1 + i)2 / 2 |
| = (1 + 2i + i2) / 2 | |
| = (1 + 2i - 1) / 2 | |
| = 2i / 2 | |
| = i | |
| so √i = (1 + i) / √2 | |
This shows how complex number arithmetic works.
Complex numbers can be plotted on the complex plane. This looks like an ordinary x,y graph, with the real numbers along the x axis, and imaginary numbers on the y axis. Select real and imaginary numbers to see it plotted on the complex plane. Something interesting happens to a complex number when you multiply it by i. Try clicking on the Multiply by i button several times.
|
|
The Mandelbrot set is a mathematical formula which uses the complex plane to make stunning pictures. Here is a picture of one part of the Mandelbrot set.
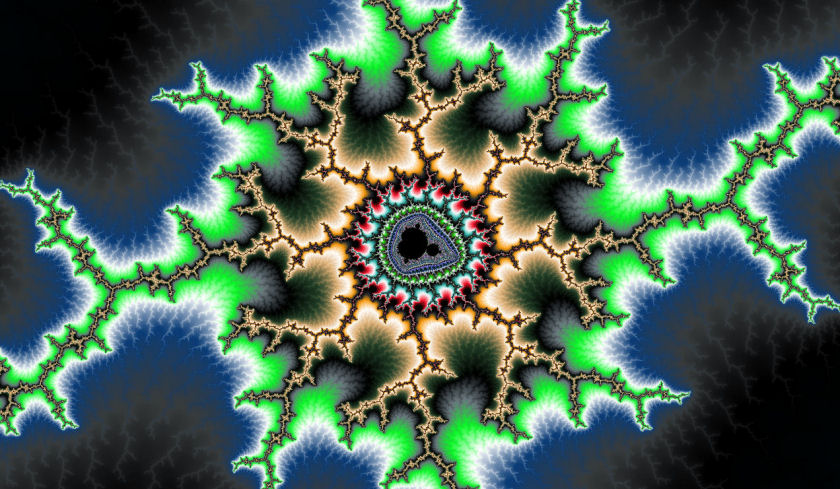
This is an incredibly complicated picture. If you magnify any part of it, that part will be equally complicated. This makes it a fractal. The black bit is inside the Mandelbrot set itself. You construct the set like this.
The formula is zn+1 = zn2 + c
c is a point on the complex plane. For each point on the picture, you have to do the following calculations for the corresponding value of c. Let's just take one value of c for the time being.
z0, z1, z2, ..., zn, zn+1 are a sequence of values of z. You start with z0 being zero. The formula then gives you z1. You feed that back into the formula to get z2 and so on. All the z's are, of course, complex numbers, since c is. We are interested in whether z tends to infinity. Luckily, we don't have to take it to infinity! If z gets greater than 2 in magnitude, then we can guarantee that it will end up heading for infinity.
So we do all this 'feeding back into the formula' (iterations). We count the number of iterations until z gets bigger than 2. We give each of these number of iterations a colour - if there were five iterations until z gets bigger than 2, we might colour that point blue. If there were eight, we might colour the point red, and so on. The colour is arbitrary - people just choose colours that look nice!
However, if the number of iterations is very large, and z still hasn't reached 2, it probably never will. So that point is likely to be inside the Mandelbrot set, and the colour of that point is traditionally black. We have to choose the number of iterations before we assume this according to how much we're zoomed in, but it could be thousands of iterations.
This means that we may have to do thousands of calculations for a single point, and this has to be done for every point in the picture, leading to billions of calculations. You need a computer, and even so it can be slow! But very pretty.
© Jo Edkins 2007 - Return to Numbers index